Inelastic Analysis
The last article on Pressure Vessel Forces discussed the distinction made between primary and secondary stresses in pressure vessel analysis. Primary stresses arise away from stress concentrations, whereas a secondary stress will be superimposed on the underlying primary stress within the region of a stress concentration.

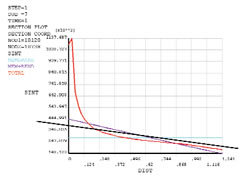
Figure 1 shows a typical FEA post-processor plot of a stress invariant (twice maximum shear stress) labelled ‘Total’, in red, plotted against radial distance through a section of a pressure vessel. The other two coloured lines are the membrane and (membrane plus bending) stresses, determined automatically by the post-processor, using a standard calculation. The ‘Total’ stress curve here is typical in that it shows a significant superimposed secondary stress component, seen as the sharp upturn in the curve, occurring on the inner radius of the vessel wall.
The last article mentioned the difficulty in decomposing total stress across a cross-section into primary and secondary stresses. The standard calculation used to produce the membrane and bending stress in the diagram cannot eliminate the effect of secondary stress and it can be seen that the purple curve over-estimates the extremes of (membrane plus bending) primary stress through the cross-section. Although not a very consistent approach, a ‘best fit’ line can give a better estimate of primary stresses. Such a line is superimposed in black in the diagram.
Differentiating between primary and secondary stress is done in order to account for the different failure modes of the vessel. Since secondary stresses are localised and self-limiting (see previous article on Pressure Vessel Stresses) they can be allowed to safely exceed the yield stress, introducing plasticity into the structure. But primary stresses cannot be allowed to exceed yield. The highlighted difficulties of separating primary and secondary stress may be avoided by taking a more direct approach wherein the plasticity of the material is considered directly in the analysis. In the pressure vessel codes, this is termed the inelastic route to qualification, but plasticity in FEA has many applications outside pressure vessel analysis.
Inelastic analysis requires the incorporation of some form of a nonlinear stress-strain curve, as has been described in previous articles. It may also require the inclusion of what is commonly referred to as ‘nonlinear geometry’ or ‘large displacement theory’. Linear elastic static FEA is based on small displacement theory and does not consider the effect on the solution of geometry changes in the structure. Since most engineering materials are ‘stiff’, this assumption is appropriate and in many applications, significant loads can be sustained without the shape of the structure changing enough to affect the calculation of internal equilibrium and stress. Conversely, some structures might involve appreciable changes in shape before failure. This is often the case when the yield stress is exceeded over large regions of the structure, as strains and hence displacements can then increase substantially with little increase in load. In any analysis involving plasticity, the numerical solution process is broken down into several increments, each one representing a portion of the load. The solution attempts to achieve numerical convergence for each increment in turn, starting from the lowest and proceeding to the full load, if possible. For a large displacement analysis, the solution process has the extra complication of updating the geometry of the structure at each increment.
The inelastic route in the pressure vessel codes allows two types of analysis: limit analysis and plastic analysis. Limit analysis is the simpler of the two and is based on small deformation theory and an elastic perfectly plastic or rigid, perfectly plastic material model. The stress-strain curves for these are given in Figure 2 and consist of two stiffness curves, intersecting at the yield stress. These are obviously theoretical but can be considered as simplified versions of the first two portions of the more realistic stress-strain curve described in the cyclic plasticity article (path A-C). (The portions after point C of the previous curve are only relevant if the load is applied more than once.)

The limit load is the failure load predicted by a limit analysis. Its magnitude is given as the maximum load increment in which a well configured non-linear analysis can achieve a solution (convergence). Providing the yield stress figure used is accurate, the usefulness of the limit analysis and corresponding limit load definition lies in that it is usually a conservative estimate of the actual failure load of a vessel. This is due to the post-yield stiffness of zero effectively preventing any load beyond that causing yield to be sustained by yielded regions in the FE model. Although a more accurate result will be gained with a more representative material model, unlike in a limit analysis, conservatism is not assured.
Plastic analysis is essentially a more complex version of limit analysis, with an improved representation of the actual material stress-strain relationship, typically made up of three or more straight line portions. It also uses large displacement theory. The next article will discuss both approaches further


